Most attendance analytics fail for a reason that has nothing to do with the analytics. They are built as a separate destination — a reporting module, a hub, a tab off a menu — and a busy administrator opens it twice: once during the demo, once during onboarding. The insight is real. The habit never forms.
So when we built attendance analytics, we put it where administrators already look: inside the Attendance lens on Dashboards. Not a new destination. Three new sections of one you already open.
A heatmap, because averages hide the thing you need
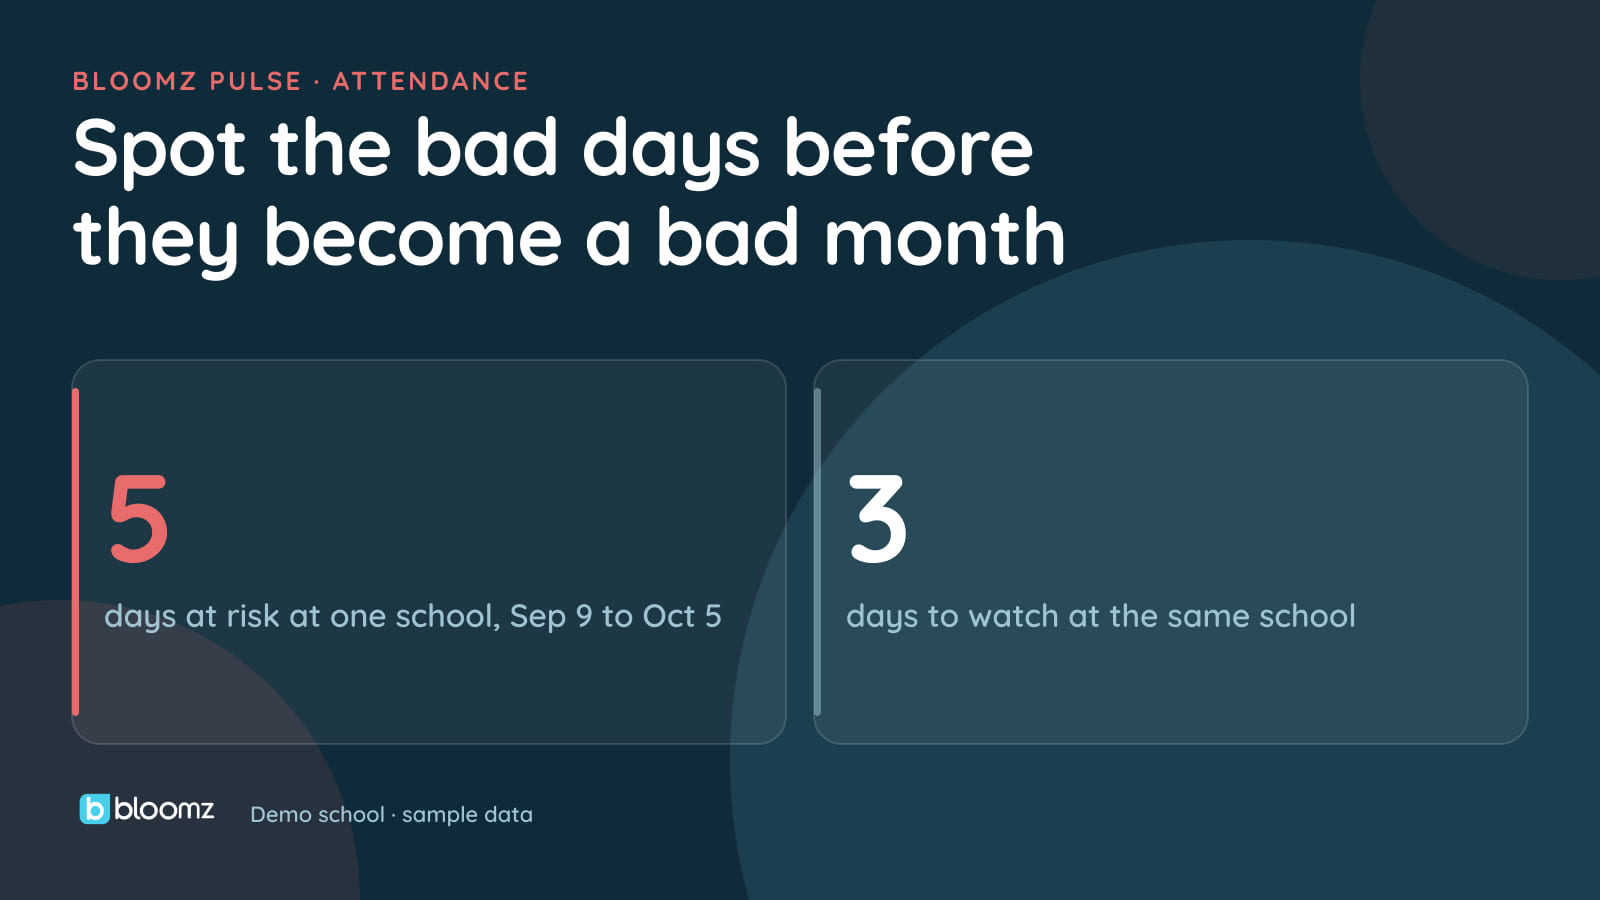
A monthly attendance average of 92% can be a good month or a five-alarm problem, and the average cannot tell you which. The absence-rate heatmap colors every single day, so the shape of the problem is visible: the slow Friday drift, the week a bug went through third grade, the one bad Wednesday in Room 12 that an average smooths into nothing.
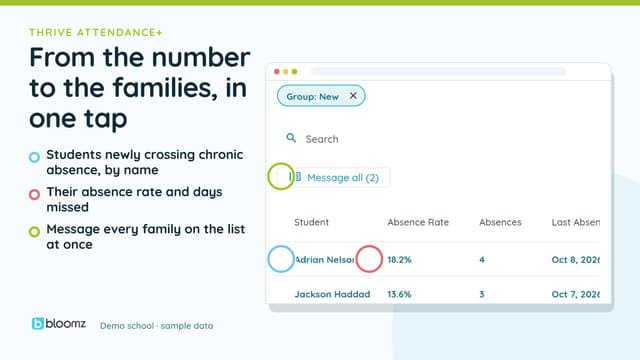
Underneath it is a searchable per-student breakdown, so “that day looks wrong” becomes a short list of names: set the range to that day and search the students behind it, without leaving the page.
What absence costs, in the numbers your business office uses
For districts funded on average daily attendance, absence is not only an academic problem — it is a budget line. The ADA funding estimate translates the absence rate for the range you are already looking at into the dollars it represents.
District administrators set the funding rate once and every school inherits it, so a principal is never guessing at a number the business office already knows. It is an estimate for planning conversations, not a claim filing — and we label it that way in the product.
The gap daily attendance structurally cannot see
Daily attendance asks one question: was this student here today? That question has a blind spot, and every high school knows it. A student can be marked present at the bell and be missing from fourth period every Thursday for a month.
For schools whose attendance feed includes periods, the period-by-period report surfaces exactly that pattern, filterable to a single student when you are building a case for an intervention.
Families get their own child, and only their own child
The same underlying record powers a guardian-facing view: a parent opens their child’s profile and sees that child’s attendance history — the aggregate and the day-by-day list.
They do not see the heatmap. They do not see the roster, the class breakdown, or any other family’s child. Same numbers, scoped to the one student they are entitled to.
Why this is not its own tab
We had built a standalone hub for this. We deleted it.
Bloomz had reached the point where attendance analysis could be reached three different ways — a More-menu tile, a Thrive dashboard tab, and a hub page — two of which were separate implementations of the same five endpoints, one of them ungated. That is how a platform ends up with three screens that disagree with each other.
There is now exactly one implementation, living in the Attendance lens, reachable from the Thrive dashboard as a second door into the same room. Fewer surfaces, one answer.
Where it is
Attendance Analytics is part of Bloomz 360, alongside Thrive and Attendance Conversations. It is off by default and enabled per school. See it on the Insights & Analytics page, or in the 2026-27 What’s New walkthrough.
Attendance is one lens of many: see how every Pulse number opens the records behind it in Bloomz Pulse: Every Number Is a Door.