by Horacio Ochoa, on Jan 29, 2021 1:04:56 PM
With the sea of data that school administrators are exposed to, they could spend hours of their day breaking down and analyzing to extract actionable insights. But who's got the time?
That's why here at Bloomz we're always looking at ways we can make educators life easier, providing the tools they need to better connect, communicate and coordinate with their community. In that spirit, we have added great tools for administrators to break down the behavior and health data collected in their Bloomz platform.
Starting today, administrators with an eligible school subscription will see two new sub-tabs in their school's Reports tab: "Behavior" and "Health." (Note: to provide you with the best experience, these reports are only available on your web browser and not on mobile apps).
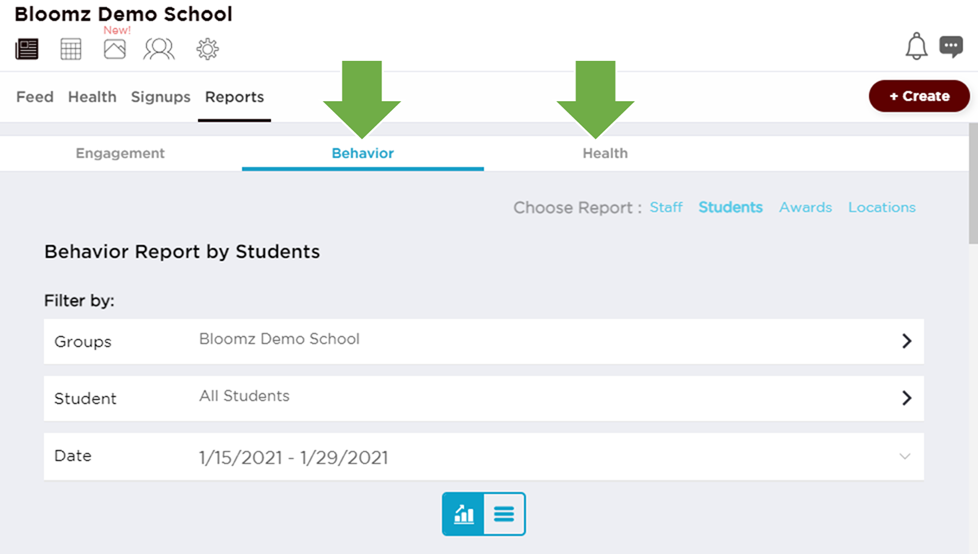
Behavior Reports
Since we launched our Student Behavior tool, we have seen teachers capture millions of activities and awards in their classrooms. With a more recent update, we also allowed administrators to add certain controls and flags to standardize the monitoring of these behaviors across their schools.
Now, we've taken a step further to provide school administrators with the tools to view and analyze behavior data, so they can do more with it. With these new reports, administrators looking to address student behavior through data (e.g. PBIS or Positive Behavioral Interventions and Supports) can use a wealth of information available to affect student outcomes.
Trends over time
With a new graph-view, administrators can see the trends in their students behavior across time.
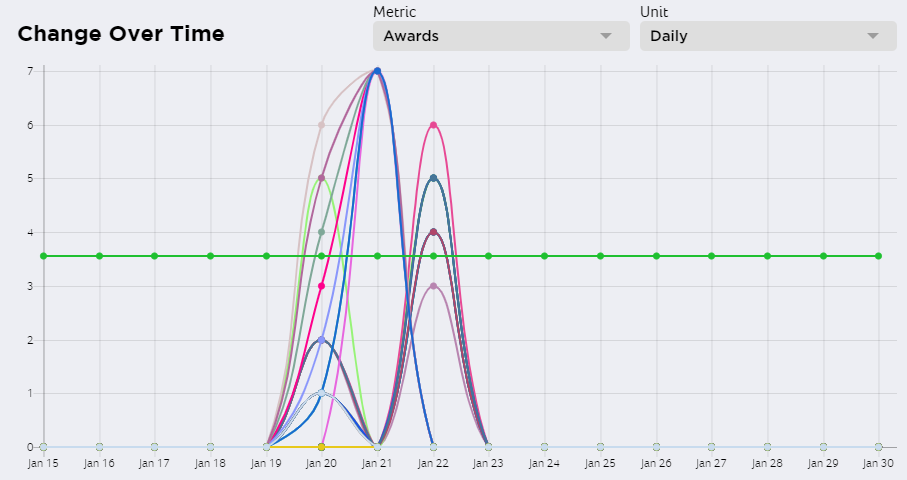
* In the graph view, you can also highlight a group or student you want to pay attention to.
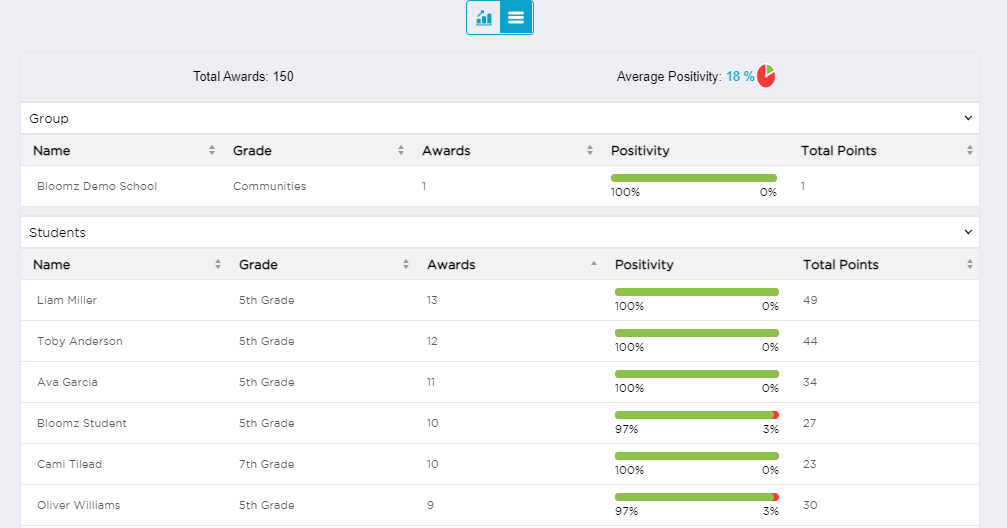
Detailed reports
Administrators can also filter reports by class/group or throughout the whole school, or for specific periods of time, to better understand the numbers.
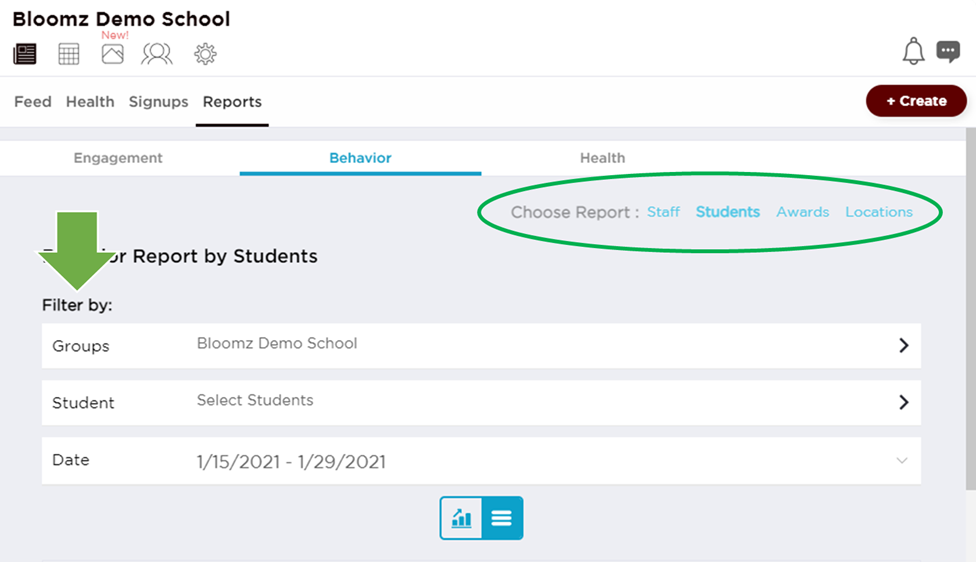
Actionable Metrics
Administrators can choose from a variety of reports: Student trends, Staff giving the awards, by Location where they are given or even by Award type. You can also adjust the dates for the report to focus around specific events or seasons, giving administrators a wide range of options to analyze.
You can read more about how behavior reports work in our support library here.
Health Reports
Similar to the new Behavior Reports, we've added new functionality to help administrators better understand the health of the members of their community. In the current times, this will be a very useful tool to see catch hot-spots early and make decisions in benefit of the students and their staff.
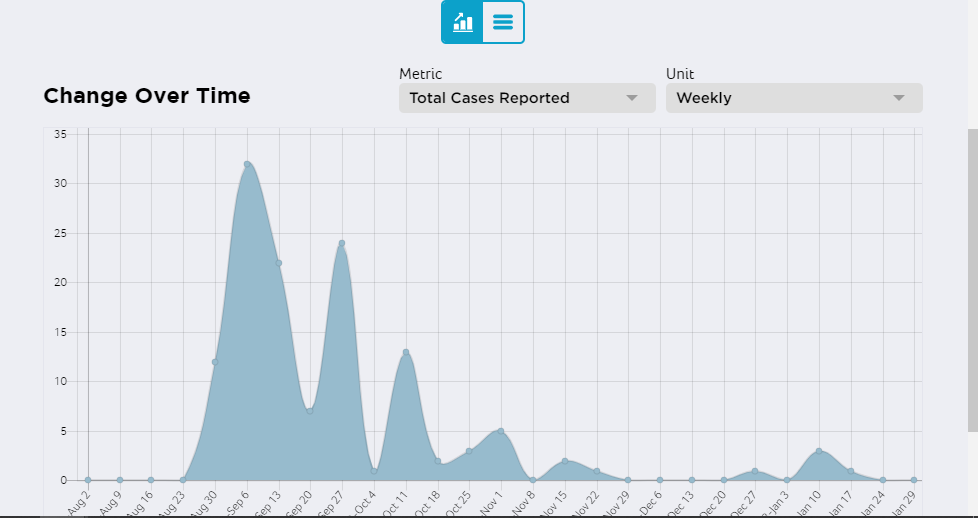
Health trends
The new graph view, allows administrators see trends in the reported health from their community and break it down to early detect potential hotspots.
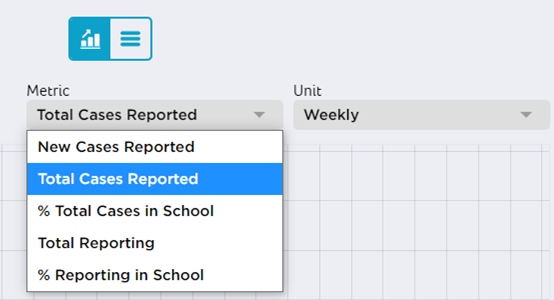
Actionable Metrics
The new reports will not only help administrator analyze positive cases reported, but also understand the rate of people submitting health reports, whether at the student or staff level, to correct course when needed.
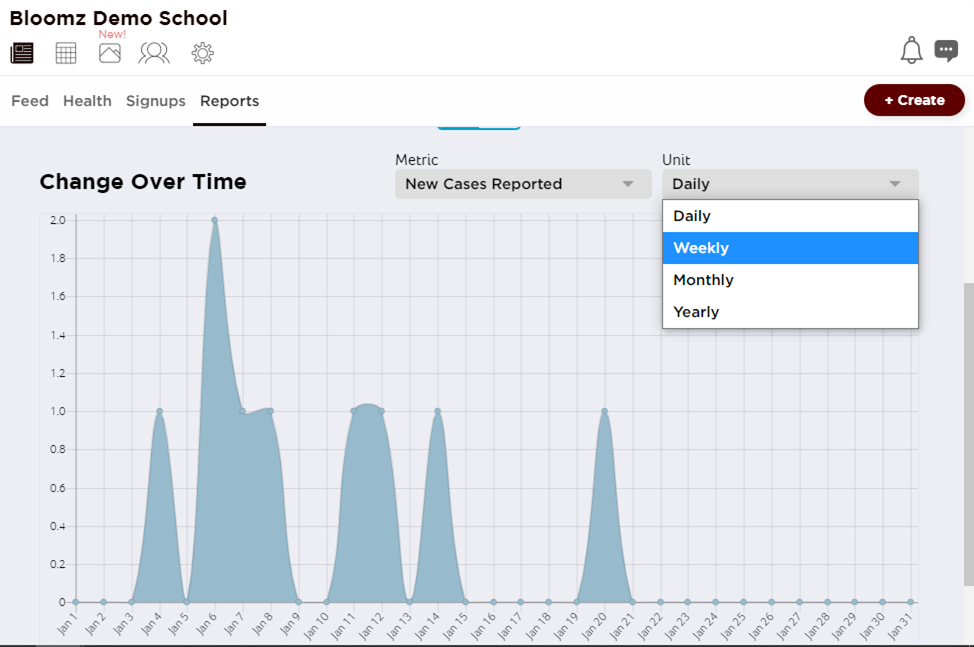
Granular views
Administrators can customize reports to specific time periods and aggregate data daily, weekly or monthly, to better understand trends and magnitude over time.
With these additions, school administrators gain new capabilities to use and analyze data to make better, more informed decisions.
If you are interested in learning more about this and all the benefits of school-wide communication, reach out to us for a free demo by clicking on the button below.