


District and School Administrators can harness the power of Bloomz PBIS/SEL Behavior Engagement Reports to analyze district-wide and school-based behavior data, enabling the effective implementation of Positive Behavioral Interventions and Supports (PBIS). By utilizing tools like the app PBIS, administrators can identify trends and gaps in student interactions across various locations and settings within their schools. This comprehensive insight aids in developing a robust PBIS behavior plan that enhances both student behavior and academic success. With the ability to filter behavior data by groups, staff, and specific time frames, schools can make informed decisions that foster positive environments and support all students effectively.
Data can support evaluation of student interactions to identify gaps, trends or key area of improvement/needed improvement regarding student behavior at your schools to make informed decisions in your community.
Choose the Report filter to show data of behavior documentation by staff, student, behavior interaction or location depending on your intention for data gathering.
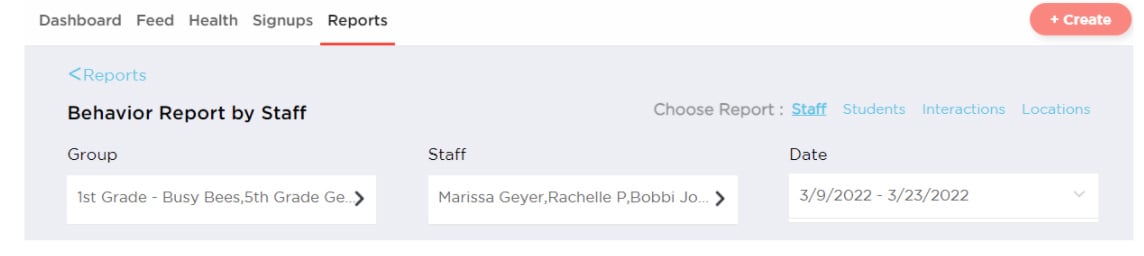
Focus in on particular Groups, Staff and Dates to get the granular data you want to see for your community.
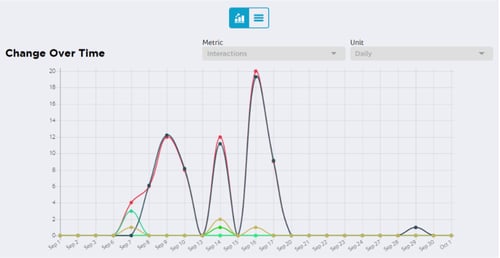
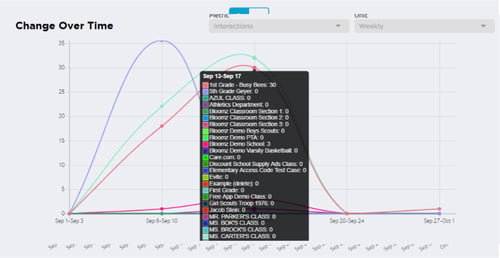
Evaluate & continue to filter the behavior report with the metric and unit dropdown selections in order to see graph data from various views for the metrics you have selected. Click on the graphing points of data will allow you to see more statistics.
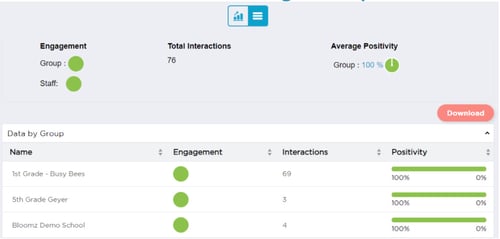
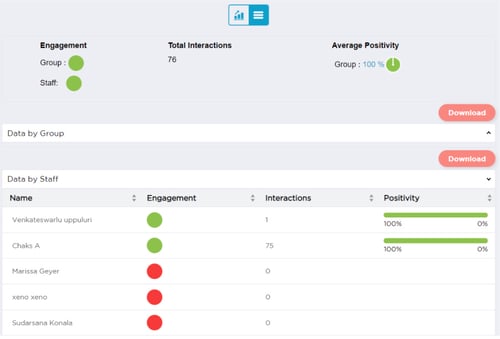
Toggle to the interactive data chart option in order to choose to look at data by Group or by Staff and assessing their Engagement, Interactions and Positivity scale visible in this report.
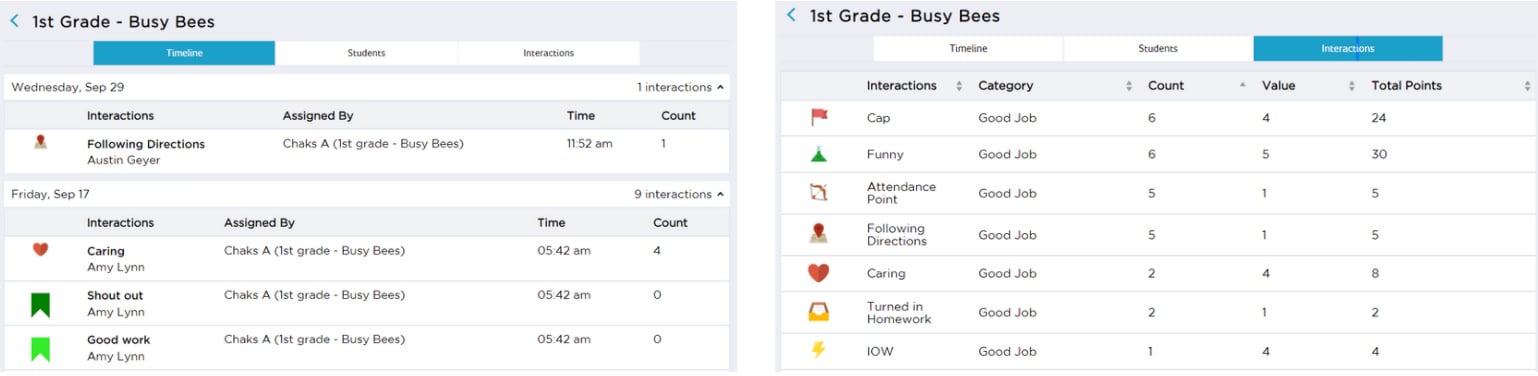
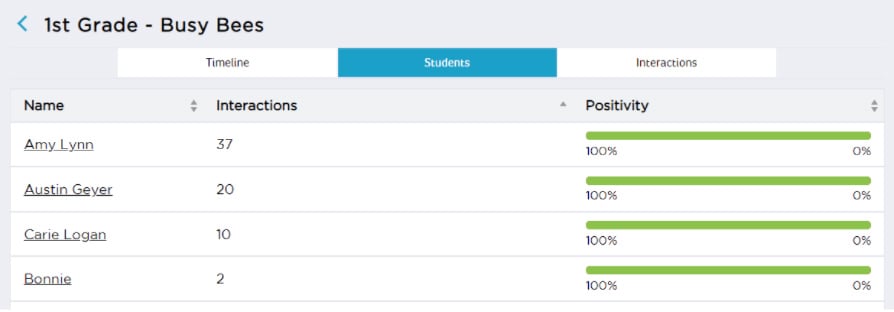
Want to dive in to see deeper data with multiple views? Click on the Interactions area in the Chart Report to dive deeper and see filters that give you more data that is narrowed down for specific results. Data will be available in the area of Timeline, Students, & Interactions.
Easily download your data by clicking the Download button on your Behavior Reports Chart page for your Groups and Staff Behavior Engagement based on the report filters & metrics you have chosen to view.
Book a Time for a Bloomz App Product Demo! ![]()
Bloomz is the gold-standard communication app for admins, teachers, and students. The app connects teachers with students, and teachers with parents. Bloomz is designed to be a time saver for administrators, a valuable tool for teachers, and increases engagement among both students AND parents.
